
 +91 9769870994 / +91 9136007425
  tips2trade4u@gmail.com
ADVANCED TECHNICAL ANALYSIS COURSE
REGISTER NOW.
Advanced Technical Analysis Course
₹ 36,000/-
Course Details
About The Course
- Listed In : Technical Analysis
- Language : English / Hindi
- Difficulty : Intermediate
- Program : Live Online / Classroom
COURSE HIGHLIGHTS
- The Stock Market Technical Analysis Course Benefits Students, Working Professionals, Business Owners, and anyone passionate about understanding trading /investing concepts techniques
- Personalised one-on-one training for Individual Traders and Investors at their homes. (Only Applicable For Mumbai Trainees)
- Trainees Get Complete Access To All Course Materials, Including Online Presentations, Notes & Tutorials.
- The Course Is Taught By India’s Leading Financial Trainers, Who Have Successfully
Trained 100000 + Students. - A Live Interactive Program Where Learners Can Ask Questions, Solve Doubts Work On Real Scenario Problems; All In Real Time Along With Ample Hands-On Practice.
- Flexible Course Timings As Per The Trainee And Trainer’s Schedule
- Rigorous Training & Exercises For A Deeper Understanding Of Course Contents
Involving Through Analysis of 40+ Stocks, Indices and others. - The Course Helps You Discover Your Unique Trading Style Via Ample Exercises,
Live Training, Analysis and More. - A Global Oriented Curriculum
- Lifetime Support In Terms Of Solving Doubts, Queries And Advice
- Advanced Technical Analysis Course provides individuals with the knowledge of using advanced tools in Technical analysis which in turn helps the student in taking the right trade.
- The course is designed for covering the essentials of work and function associated with financial markets. It highlights the importance of sustainable profits acquired by planning out strategies and analysing the trading pace of the market.
- With coverage of critical course trading strategies, trainees get introduced to Hangman, Spinning Top, Shooting Star, etc., which helps individuals gain their trading style and adaptable judgement. The curriculum is kept global that provides trainees with successful career opportunities in the share market.
PRACTICAL HANDS-ON KNOWLEDGE ON :
- Practical Training On Profitable Trading Methods Involving Equity And Commodity Markets
- Live Market Training On Positional & Intraday Charts
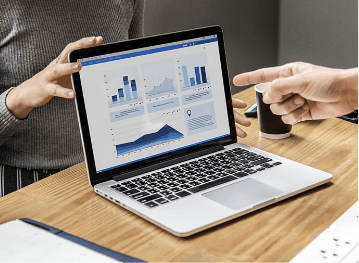
OVERVIEW

The Advanced Technical Analysis Course is designed for individuals who wish to understand the workings and functioning of financial markets. A Global Centric syllabus, where trainees will study and analyse Global Economic data of significant countries like the USA, China, India and More.
A technical course where trainees will receive practical hands-on training.
The course will cover several crucial profitable trading strategies like Hangman, Spinning Top, Shooting Star, etc., and help trainees discover their unique trading styles.
After completing the course, trainees will confidently analyse stocks, indices, commodities, understand practical financial terms & categorise stocks independently.
The course teaches trainees to make confident profitable decisions.
OBJECTIVE
- The course objective is to create and increase awareness about the importance and benefits of Technical Analysis to improve sustained profitability.
- Unlike other organisations offering financial training courses, we provide one-on-one personalised training to individual traders and investors residing in Mumbai. Trainees located outside Mumbai can learn via our online presentations, notes, tutorials and live classes.
BENEFITS
- Live Online Classes Where You Can Learn From The Comfort Of Your Homes
- Online Sessions As well as classroom learning
- Understand The Important Concepts Of Charting
- Practical Hands-On Training Via Live Projects
- Trainees Will Be Able To Take Confident Financial Decisions, Making Sustained Long-Term Profit
- Flexible Course Timings
- Global Curriculum
- Successful Completion, Of Course, Offers Numerous Career Opportunities In The Share Market Industry
- Affordable Course Fees
INTENDED PARTICIPANTS
- Trader
- Investors
- Finance Students
- Freshers/Recent Graduates
- Working Professionals Working For Financial Institutions/Banks/Mutual Funds, etc.
TOPICS COVERED
- Difference between Technical & Fundamental Analysis
- Importance of Dow Theory
- Construction of candlestick patterns
- How to identify strong support & resistance levels (Pivot points)
- Identification of stocks for intraday & long term portfolio
- How to build a strong portfolio to beat the best mutual funds with lesser capital
- 33 Important Reversal & Continuation Patterns with extremely profitable trading strategies like:
- Engulfing patterns
- Hangman
- Spinning Top
- Shooting star
- Inverted Hammer
- Piercing & Dark cloud Cover
- Harami Patterns
- Star pattern
- Tower Top & Bottoms
- Dumpling top & Frypan Bottoms
- Shaven Top & Bottom
- Doji
- Counterattack Lines
- Hammer etc.
- Significance of Gaps in intraday & short term trading
- Use of Momentum Indicators to successfully identify trend reversals
- RSI
- RSI Divergence for short term & intraday trades (90% strike rate)
- Volume Analysis
- Moving Average (EMA) for both intraday & long term supports & resistance
- Moving Average Convergence Divergence (MACD)
- Bollinger bands
- ATR
- Stochastic Oscillator
- Supertrend
- How to draw trend lines to trade based on price action strategies
- How to use Fibonacci projections & retracements to identify long term & short term (intra-day) targets
- Impact & significance of global equity markets on Indian markets
- Practical live market training experience on positional & intraday charts
- Exercise to analyze over 50 stocks, indices, commodities during the course
Course Duration
Group Training :
2 students: Pay Rs. 64,000/ ONLY
3 students: Pay Rs. 84,000/ ONLY
Eligibility Criteria
Course Fees :
Rs. 36,000/- Per Student
COURSE COLLECTIONS
BASIC TECHNICAL ANALYSIS COURSE
BASIC EQUITY FUNDAMENTAL ANALYSIS COURSE
EQUITY FUNDAMENTAL ANALYSIS COURSE
COMMODITY & CURRENCY COURSE

LONG TERM FUND MANAGEMENT COURSE(LTFM)
ADVANCED TECHNICAL ANALYSIS
Faculty Members

Mr. A.R.Ramachandran
CO-FOUNDER, MAIN TRAINER

Ms. Pavitraa Shetty
CO-FOUNDER, TRAINER
FAQs
What is the best technical analysis course?
We offer the best technical analysis course in India where you can efficiently learn technical analysis.
How can I learn technical analysis?
Learn technical analysis from our best technical analysis courses in Mumbai.
Is Technical Analysis enough for trading?
If you want to trade then there is much want to learn than a technical analysis course. Browser our wide range of courses.
Can technical analysis make money?
Yes definitely. Technical analysis will help you decide on investing that will offer you great profit.
Mumbai Address
541-D, 4-B, 1st floor Shrijiniketan,
Dr Ambedkar Road, Above Matunga
Clinic Matunga, Mumbai-400019.
 tips2trade4u@gmail.com
 +919769870994 / +919136007425
COPYRIGHT © 2018 TIPS 2 TRADE. ALL RIGHTS RESERVED (TERMS OF USE)
